
In our fast-paced business environment, the inefficiency of manual reporting has become increasingly apparent. We often find ourselves buried under mountains of spreadsheets, emails, and paper documents, all of which require painstaking effort to compile and analyze. The process of gathering data from various sources can be time-consuming and prone to human error.
As we sift through countless reports, we may inadvertently overlook critical information or misinterpret data, leading to misguided decisions. This inefficiency not only hampers our productivity but also stifles our ability to respond swiftly to market changes. Moreover, the reliance on manual reporting can create a bottleneck in our workflow.
When we depend on individuals to compile and present data, we risk delays that can affect our overall performance. Team members may be overwhelmed with their regular responsibilities, leaving little time for thorough reporting. As a result, we often find ourselves in a reactive mode rather than a proactive one.
The lack of real-time insights can hinder our strategic planning and limit our capacity to seize opportunities as they arise. In essence, manual reporting can become a significant obstacle in our quest for efficiency and effectiveness.
Key Takeaways
- Manual reporting is inefficient and time-consuming, leading to potential errors and delays in decision-making.
- Hidden costs of manual reporting include the labor hours spent on data collection and analysis, as well as the opportunity cost of delayed insights.
- Dashboards streamline reporting processes by consolidating data from multiple sources and presenting it in a visually accessible format.
- Using dashboards saves time and resources by automating data collection, analysis, and visualization, allowing for faster and more accurate reporting.
- Dashboard reporting offers improved accuracy and timeliness, providing real-time insights for better decision-making.
The Hidden Costs of Manual Reporting
While the inefficiencies of manual reporting are evident, the hidden costs associated with this practice are often overlooked. We may not immediately recognize that the time spent on compiling reports translates into lost productivity. Each hour dedicated to manual data entry or report generation is an hour that could have been spent on more strategic initiatives.
As we calculate the cumulative hours wasted across our teams, it becomes clear that manual reporting can significantly impact our bottom line. Additionally, the potential for errors in manual reporting can lead to costly consequences. When we rely on human input, the risk of inaccuracies increases, which can result in misguided decisions based on faulty data.
These errors may not only affect our immediate operations but can also damage our reputation with clients and stakeholders. The financial implications of rectifying these mistakes can be substantial, as we may need to invest additional resources to correct errors or mitigate their effects. Thus, the hidden costs of manual reporting extend far beyond the immediate time investment; they encompass a range of financial and reputational risks that we must consider.
How Dashboards Streamline Reporting Processes
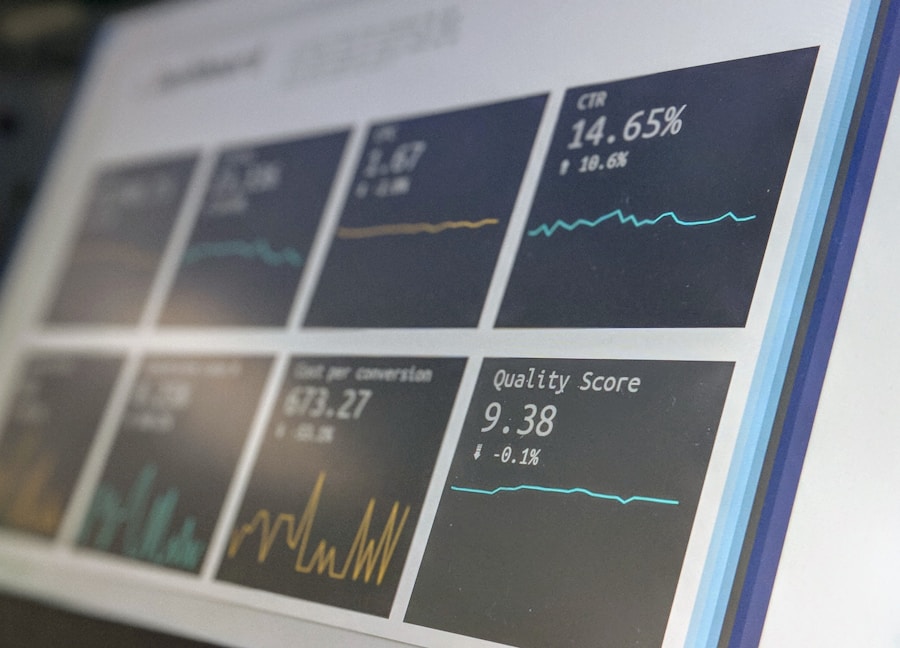
In contrast to the cumbersome nature of manual reporting, dashboards offer a streamlined approach that enhances our reporting processes. By consolidating data from various sources into a single visual interface, dashboards allow us to access critical information at a glance. This centralized view eliminates the need for us to navigate through multiple spreadsheets or documents, saving us valuable time and effort.
With dashboards, we can quickly identify trends, monitor key performance indicators (KPIs), and make informed decisions based on real-time data. Furthermore, dashboards facilitate collaboration among team members by providing a shared platform for data analysis. Instead of relying on individual reports that may vary in format and content, we can all access the same dashboard and interpret the data collectively.
This collaborative approach fosters transparency and encourages open discussions about performance metrics and strategic goals. As we work together to analyze the data presented in dashboards, we can align our efforts more effectively and drive our organization toward success.
The Time and Resource Savings of Using Dashboards
The implementation of dashboards not only streamlines our reporting processes but also leads to significant time and resource savings. By automating data collection and visualization, we can reduce the hours spent on manual reporting tasks. This newfound efficiency allows us to allocate our resources more effectively, focusing on high-value activities that drive growth and innovation.
Instead of being bogged down by repetitive tasks, we can dedicate our time to strategic planning and decision-making. Moreover, the resource savings extend beyond just time; they also encompass financial implications. By minimizing the need for extensive manual labor in report generation, we can reduce labor costs associated with data entry and analysis.
Additionally, the accuracy of dashboard reporting minimizes the risk of costly errors that often arise from manual processes. As we embrace this technology, we not only enhance our operational efficiency but also create a more agile organization capable of adapting to changing market conditions.
The Accuracy and Timeliness of Dashboard Reporting
One of the most compelling advantages of dashboard reporting is its ability to provide accurate and timely insights. Unlike manual reporting, which is often subject to delays and inaccuracies, dashboards deliver real-time data that reflects our current performance. This immediacy allows us to make informed decisions based on the most up-to-date information available.
As we monitor KPIs through dashboards, we can quickly identify areas that require attention or adjustment, enabling us to respond proactively rather than reactively. The accuracy of dashboard reporting is further enhanced by the automation of data collection processes. By integrating various data sources into a single platform, we minimize the risk of human error that often plagues manual reporting.
This reliability instills confidence in our decision-making processes, as we can trust that the insights derived from dashboards are based on accurate data. As a result, we are better equipped to set realistic goals, track progress effectively, and make strategic adjustments as needed.
The Benefits of Automated Data Visualization and Analysis

Uncovering Hidden Insights
By leveraging advanced analytics tools integrated into dashboards, we gain deeper insights into our data than ever before. These tools allow us to uncover patterns and trends that may have gone unnoticed in traditional reporting methods.
Driving Data-Driven Decisions
As we harness the power of automated analysis, we can make data-driven decisions that propel our organization forward. Additionally, automated data visualization enhances our ability to communicate insights effectively across teams and stakeholders. With visually appealing charts and graphs at our disposal, we can present complex information in a digestible format that resonates with diverse audiences.
Positioning for Success
By streamlining reporting processes, reducing hidden costs, saving time and resources, ensuring accuracy and timeliness, and harnessing automated data visualization, we position ourselves for a brighter future in an increasingly competitive landscape. The shift toward dashboard reporting is not merely a trend; it is a strategic imperative that will enable us to thrive in an era defined by data-driven decision-making.
If you are interested in learning more about how to streamline your reporting processes and improve efficiency, you may want to check out the services offered by NOBS Digital. They specialize in server-side tagging, which can help automate data collection and reporting tasks, saving you time and resources. Additionally, you can also take advantage of their free Google Analytics audit form here to ensure that your analytics setup is optimized for accurate and insightful reporting. By leveraging these tools and services, you can do more with less and focus on driving better results for your business.